You are here
Missing Elements in the Discussion of Teacher Shortages
CALDER Explainers are designed to succinctly describe empirical research on contemporary topics in education and encourage evidence-based policymaking.
This CALDER Explainer reviews recent reporting of teacher shortages and how the current narrative excludes important issues about the production of new teachers and the factors that impact teacher attrition.
View this explainer as a PDF here.
Introduction:
Each new school year typically spurs reporting on the shortage of teachers in national and local publications. While these stories (e.g., Partelow, 2016; Rich, 2015) and a highly-publicized recent report (Sutcher et al., 2016) generally discuss teacher shortages as a national problem, we argue that the popular conception of a “teacher shortage” is not borne out by historical data; in fact, the production of newly-minted potential teachers has increased steadily over the past several decades, and only about half of these recent graduates have been hired as public school teachers in a typical year. That said, there is considerable evidence of staffing difficulties in specific subjects (e.g., STEM and special education) and in specific types of schools (e.g., rural schools or schools serving disadvantaged students), which suggests that policies aimed at addressing these true shortage areas must be targeted to these specific teachers and schools.
The Production of New Teachers over Time:
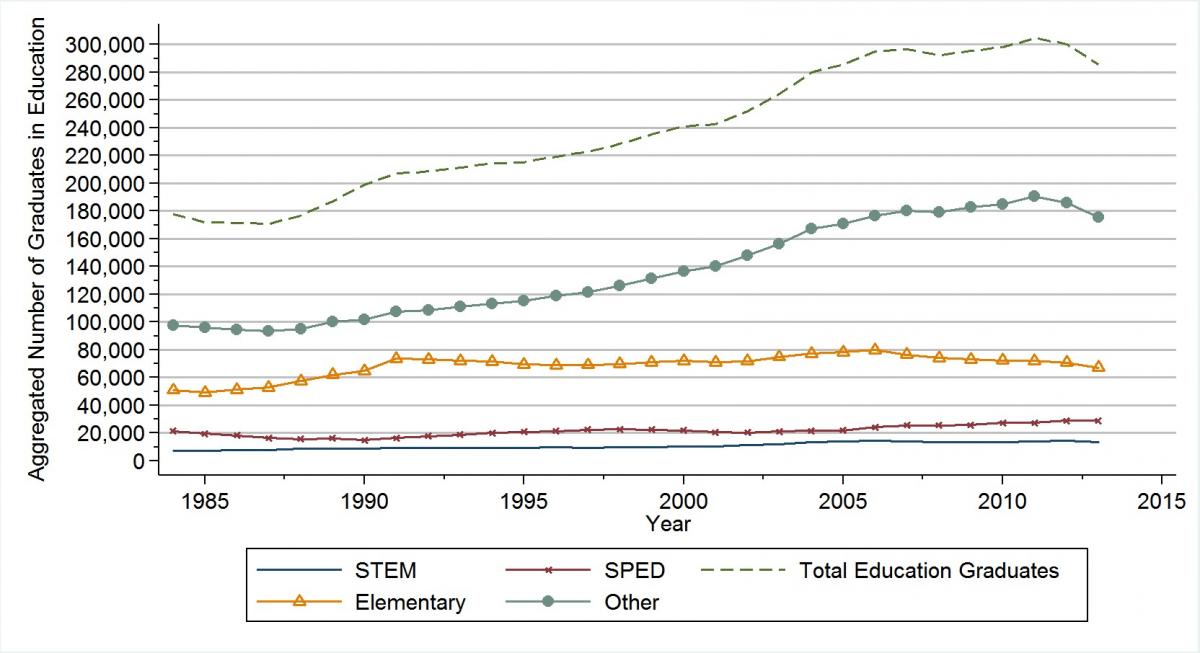
Reports on the current “teacher shortage” often begin by citing diminishing enrollment in teacher preparation programs in recent years. A story that appeared in the New York Times, for instance, focused on the declining production of new teachers in California from 2008 to 2012 (Rich, 2015). While the figures in the story are correct, looking only at the most recent years hides that teacher production has grown steadily since the mid-1980s, as shown in Figure 1.
Figure 1: Aggregated Number of Degrees in Education (1984-2013)[1]

The increase in teacher production has more than kept up with increases in student enrollment in public schools across the country. In fact, the student-teacher ratio in U.S. public schools has dropped from over 18 in the mid-1980s to about 16today.
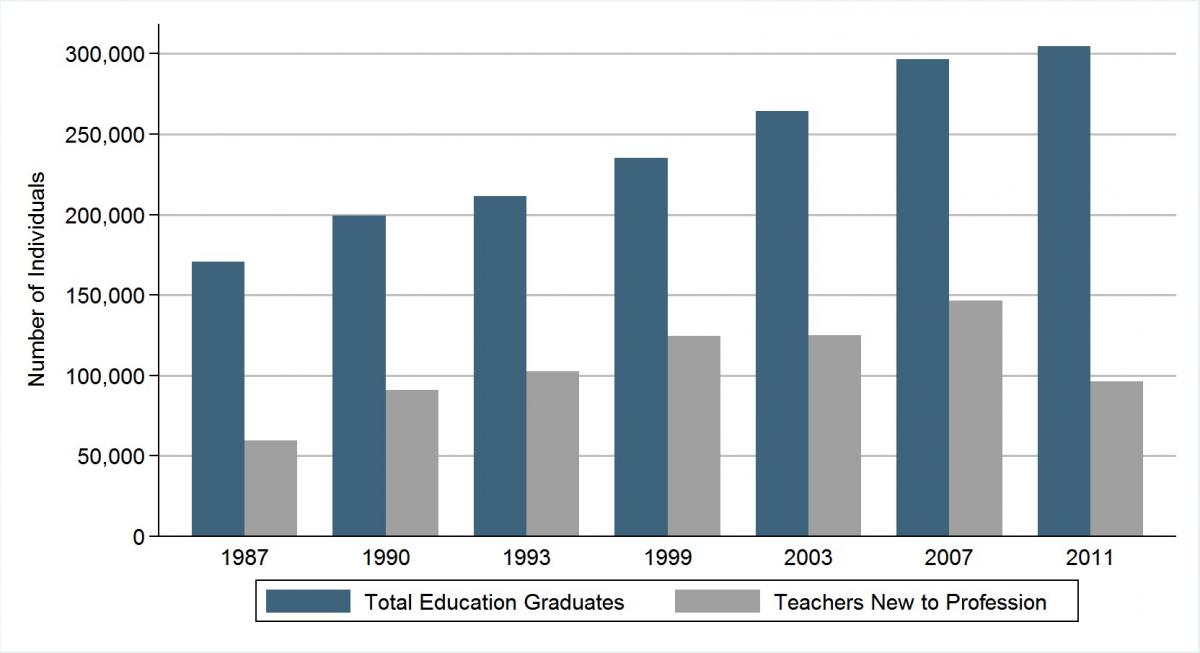
Additionally, while the number of teachers produced by teacher preparation programs has grown steadily since 1985, only about half of these teachers are hired. Specifically, Figure 2 shows that between 175,000 and 300,000 teachers were produced during survey years, but only 60,000 to 140,000 of these newly-minted potential teachers were hired into teaching positions (note that others may have been hired into non-teaching positions).[2]
Figure 2: Production and Hiring of Teachers New to the Profession (Selected Years)

Discussion and Conclusions:
The previous section illustrates that the number of potential first-time teachers has far outpaced the demand for newly-minted teachers for decades. This is important because, while enrollment in teacher education programs has dropped even more in recent years (Sutcher et al., 2016), the bench of individuals with the necessary teaching credentials to enter (or re-enter) the teacher workforce is far deeper than what would be suggested by looking at snapshots of production and hiring in recent years.
However, there is consistent evidence of persistent staffing issues in specific subjects like STEM and special education (e.g., Boe and Cook, 2006; Goldhaber et al., 2015) and in specific settings like urban, rural, or disadvantaged schools (e.g., Ingersoll, 2003). Specifically, Figure 3 illustrates that the demand for STEM and SPED teachers has been far greater than the demand for Elementary, English, and Social Studies for several decades.[3]
Figure 3: Percentage of Schools Reporting Difficulty Filling Vacancies within Specific Disciplines
Likewise, Figure 4 illustrates that urban and rural schools have historically experienced greater difficulties recruiting teachers than suburban schools.
Figure 4: Percentage of Schools Reporting Difficulty Filling Vacancies by Urbanicity
Finally, Figure 5 illustrates that schools that serve many underrepresented minority students (URM, defined as American Indian, Black, or Hispanic) have considerably greater difficulties recruiting teachers than schools that serve fewer URM students.[4]
Figure 5: Percentage of Schools Reporting Difficulty Filling Vacancies by School Percent URM
So, what can schools and districts do to address the difficulties in hiring in these specific areas or schools? Unlike other industries that often offer higher pay to compensate for less desirable working conditions or to attract more desired applicants in high-need areas (like STEM fields), public school systems are generally limited by collective bargaining agreements or state law in their ability to offer differential compensation (see Goldhaber et al., 2015). That said, there is encouraging evidence about targeted policies intended to address specific teacher shortage areas. For example, Clotfelter et al. (2008) found that a targeted bonus to certified math, science and special education teachers working in disadvantaged North Carolina schools reduced the attrition of targeted teachers by 17 percent, while Feng and Sass (2015) found that loan forgiveness programs for teachers with high-needs endorsements reduced the attrition of teachers in shortage areas in Florida.
Unfortunately, many policies being discussed and adopted across the country—such as universal loan forgiveness programs or across-the-board changes to teacher credential requirements—are motivated by the misconception that we need to increase the overall supply of teachers. We believe that these policies are akin to trying to hit a pin with a sledgehammer. That said, a more nuanced national discussion about teacher shortages that acknowledges the specific nature of teacher shortage areas could lead to more innovative policy responses that address chronic shortages in high-need subjects and schools.
References:
Boe, E. & Cook, L. (2006). The chronic and increasing shortage of fully certified teachers in special and general education. Exceptional Children, 72(4) 443–460.
Clotfelter, C., Glennie, E., Ladd, H., & Vigdor, J. (2008). Would higher salaries keep teachers in high-poverty schools? Evidence from a policy intervention in North Carolina. Journal of Public Economics, 92(5), 1352-1370.
Feng, L., Sass, T., (2015). The impact of incentives to recruit and retain teachers in “hard-To-staff” subjects: An analysis of the Florida Critical Teacher Shortage Program. CALDER Working Paper 141.
Goldhaber, D., Krieg, J., Theobald, R., and Brown, N. (2015). Refueling the STEM and special education teacher pipelines. Phi Delta Kappan 97, pp. 56-62.
Ingersoll, R. (2003). Is there really a teacher shortage? Consortium for Policy Research in Education, University of Pennsylvania: Philadelphia.
Partelow, L. (2016). Teacher shortages are solvable. US News and World Report, August 11, 2016.
Rich, M. (2015). Teacher shortages spur a nationwide hiring scramble (credentials optional). The New York Times, August 9, 2015.
Sutcher, L, Darling-Hammond, L., & Carver-Thomas, D. (2016). A coming crisis in teaching? Teacher supply, demand, and shortages in the U.S. Learning Policy Institute, September 2016.
[1] The aggregated number of degrees issued in education fields in Figures 1 and 2 may not represent the true number of newly credentialed teachers because alternatively-certified teachers are not included, individuals who graduate but do not complete the requirements to receive a teaching credential are included, and teachers who receive a Bachelor's and higher degree in education may be double-counted. Data on initial teaching credentials in recent years (2010-2013) from Title II suggest that the numbers in Figures 1 and 2 are about 15% higher than the true number of newly credentialed teachers. Calculated from IPEDS Completion Data, National Center for Education Statistics (NCES).
[2] Production data calculated from IPEDS Completion Data, and hiring data calculated from Schools and Staffing Survey (SASS).
[3] Figures 3-5 calculated from SASS data.
[4] “High URM” schools defined as schools in the top quartile of the distribution of percent URM students, while “Low URM” schools are in the bottom quartile of the distribution of the percent URM students.


